System Characteristic Curve
In the pumping system, there are two characteristic curves that determine the operating point of the pump. One is related to the pump itself, which is called the pump characteristic curve, and the other is related to the system and components before and after the pump, which is called the system characteristic curve.
System definition:
Everything that is installed on the pumping line before and after the pump, from the pumping source, which can be a tank or the valves and fittings on the line, are all parts of the system.
System curve drawing method:
To draw the system curve, the drops in the system must first be known and then they can be calculated.
Pumping system losses:
System losses are divided into two categories: static losses and dynamic losses.
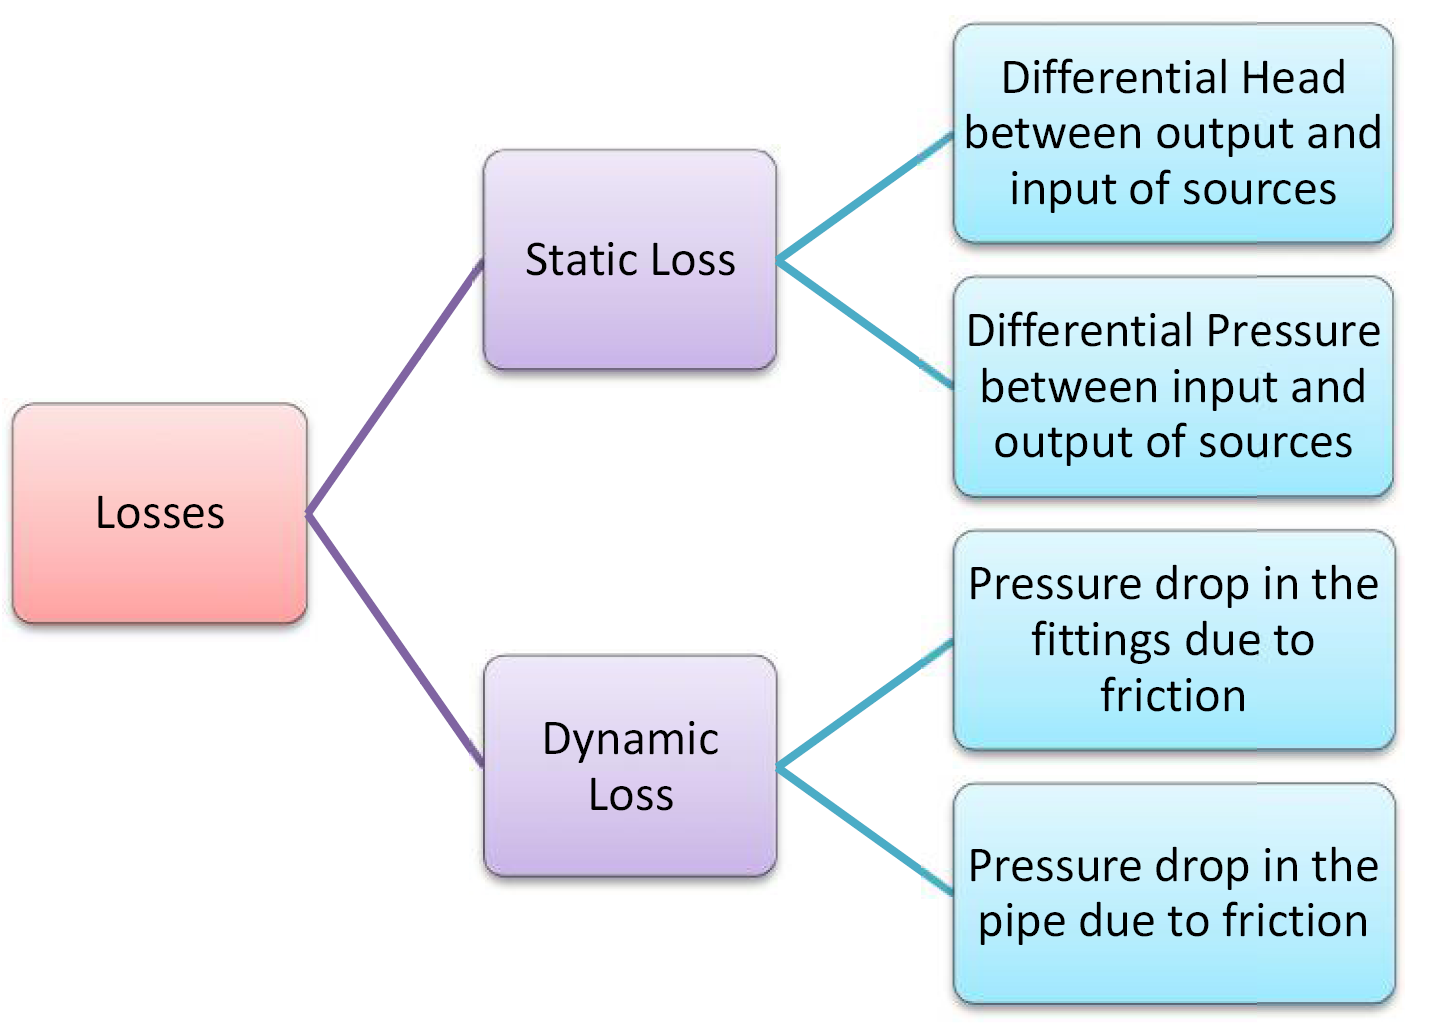
Static drop in the system can appear in two ways. This drop persists when the pump is off.
- Differential Pressure between input and output of sources:
Any pressure on the fluid, whether in the inlet and outlet tank. Reservoirs can be atmospheric or they can be pressurized. The pressure on the inlet tank is considered negative and on the outlet tank is considered positive.
- Differential Head between output and input of sources (Pump is base)
The height of the inlet and outlet tanks’ fluid relative to the pump position. The height of the inlet fluid is considered negative on the H-Q diagram and the height of the outlet fluid is considered positive on the diagram.
Example: Calculate the static drop of the following pumping system.
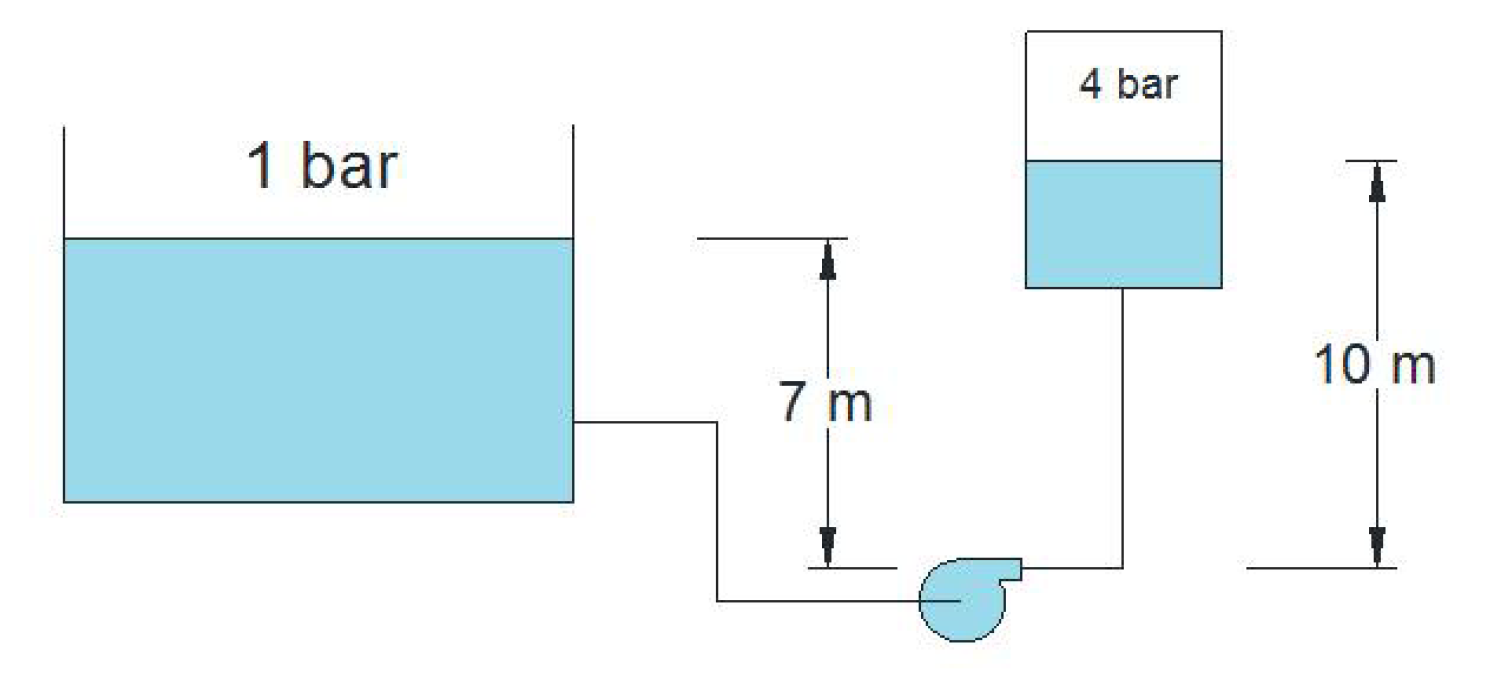 The height or head of the inlet tank is 7 meters.
The height or head of the outlet tank from the pump is 10 meters.
H1 = 7 m
H2 = 10 m
∆H = 10 – 7 = 3 m
The inlet tank pressure is 1 bar.
The outlet tank pressure is 4 bar.
P1 = 1 bar
P2 = 4 bar
∆P = 4 – 1 = 3 bar
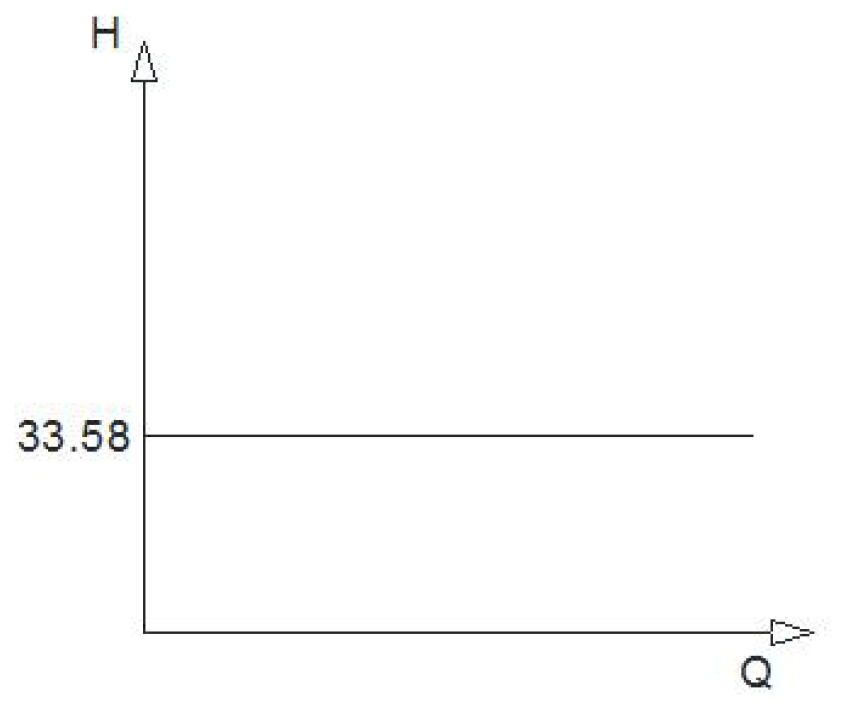
Convert the pressure to the equivalent head of the fluid:
P = ρ x g x h = 3 bar x 105 = 1000 x 9.81 x h h = 30.58 m
H total = 3 + 30.58 = 33.58 m
- Dynamic drop is also in two forms
– Pipeline route drop
– Loss of fittings
The above drops can be obtained in two ways: using a graph and using a formula.
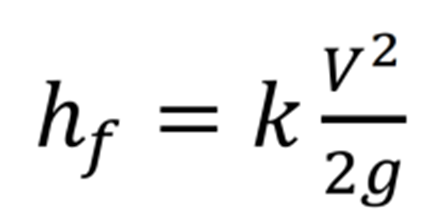
- Connection loss calculation formula
Pipe drop calculation formula
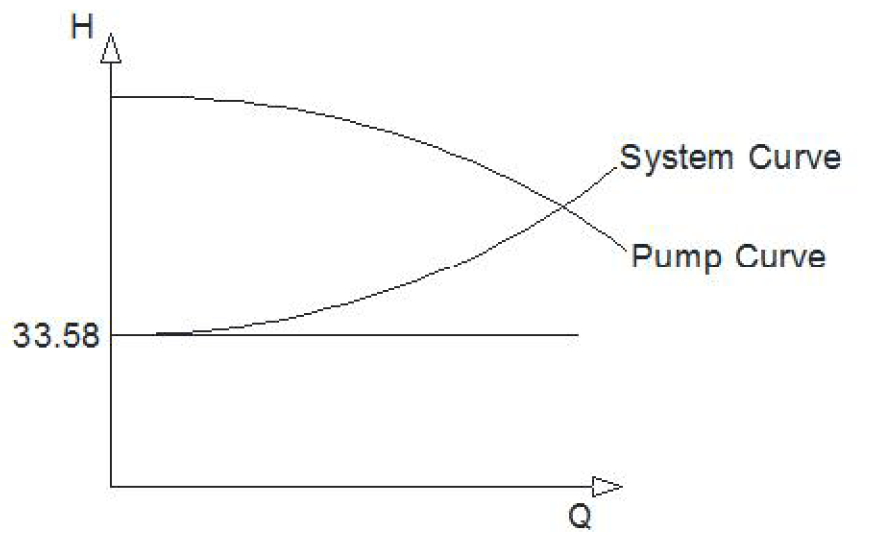
For example, if there is a valve control on the pump output line, the system curve changes as the valve control closes, so that the flow decreases and the head increases.